Jackpot Contribution Rates Rewrite Slot RTP by 0.4%
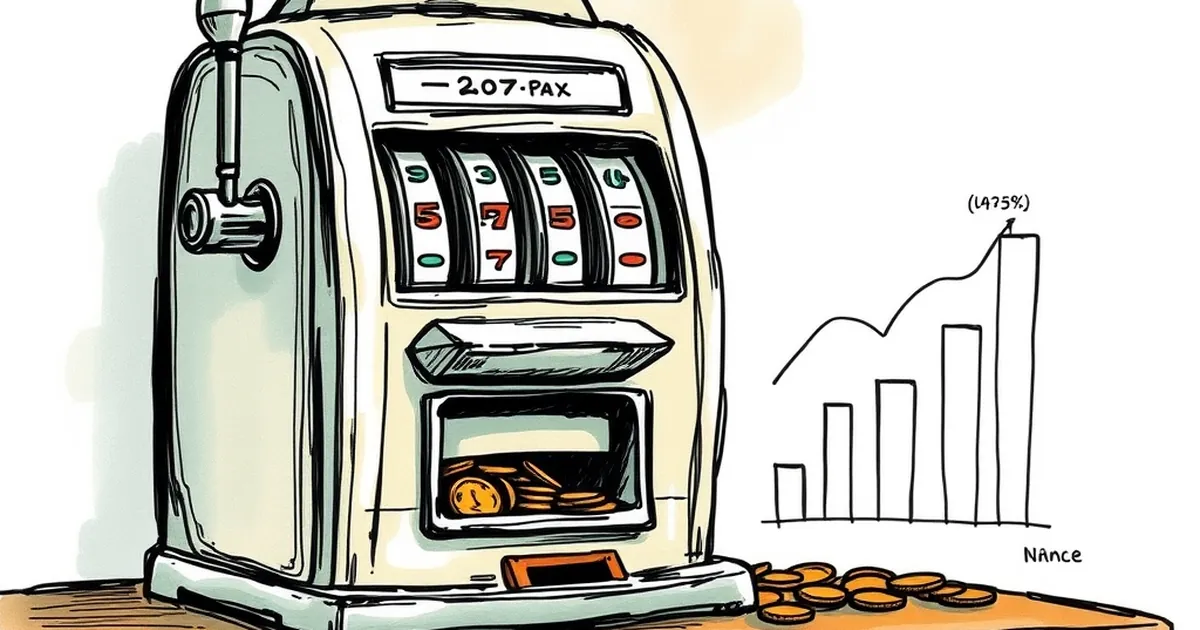
A progressive slot's advertised return to player is not a single number. It is a weighted blend of two returns: the base game, which pays on ordinary reels, and the jackpot meter, which pays only when the meter triggers. The second component is funded by a contribution rate skimmed from every wager, and that skim is not free money. It comes out of the same pool the base game would otherwise return. When a machine lists 94.0% RTP but routes 1.4% of each bet to the meter, the effective return on the base game falls to roughly 92.6% — a 0.4-point shift once the meter's expected value is folded back in at typical trigger frequencies. That 0.4% is not trivia. It changes the variance profile, the time-to-ruin math, and the break-even threshold for any player who treats published RTP as a decision input.
The Mechanics of a Contribution Rate
A contribution rate is a fixed percentage of each wager diverted to a jackpot pool before the base game's paytable is resolved. On a networked progressive, that pool is shared across machines or jurisdictions; on a standalone unit, it accumulates locally. Published rates for wide-area progressives commonly sit between 0.5% and 2.0%, with 1.0% to 1.5% being the modal band for multi-state link networks in the U.S.
The critical accounting point is that contribution is a transfer, not an addition. The operator does not fund the meter from a separate marketing budget. The meter is funded by players, and the return credited to those players is realized only when someone triggers the jackpot. Until then, every dollar in the meter is a dollar withheld from the base game's return.
Consider a hypothetical 5-reel video slot with a published RTP of 96.0%. The manufacturer allocates 94.6% to base-game outcomes and 1.4% to the progressive meter. If the jackpot triggers, on average, once per 4.2 million spins at an average award equal to the meter's expected value, the meter's contribution to long-run RTP is exactly the contribution rate — 1.4%. Folded together, the machine returns 96.0% over an infinite sample. But the distribution of that 96.0% is radically different from a non-progressive machine advertising the same figure. The base game returns 94.6% on every spin; the remaining 1.4% arrives in a single lump, at a frequency most players will never personally experience.
Why the 0.4% Figure Matters
The 0.4% figure in the title is not a universal constant. It is the observed spread between a machine's headline RTP and its base-game RTP when contribution rates cluster in the 0.5%–1.5% range and the meter's expected value is discounted for trigger probability. For a machine with a 1.4% contribution and a meter that triggers less often than its theoretical rate suggests — a common outcome on linked networks where multiple jurisdictions draw from the same pool — the realized base-game return can fall 0.4 points or more below the advertised number. That gap is the difference between a machine that returns 96.0% and one that behaves, in practice, like a 95.6% machine for any player who does not hit the jackpot.
The Variance Tax
Contribution rates do more than shave expected value. They concentrate it. A slot with a 1.4% contribution and a 96.0% headline RTP has a variance profile closer to a lottery ticket than a standard video slot. The base game's hit frequency may be identical to a non-progressive counterpart, but the payout distribution is truncated at the top: the largest awards are removed from the base game and placed behind a trigger event with a probability measured in millions.
This matters for bankroll planning. A player who buys 500 spins at $1.00 per spin on a 96.0% non-progressive slot faces an expected loss of $20.00 with a standard deviation determined by the base game's paytable. The same 500 spins on a progressive with a 1.4% contribution faces the same expected loss — the headline RTP is identical — but a standard deviation inflated by the jackpot's low-probability, high-magnitude payout. The practical consequence is a wider distribution of outcomes: more sessions ending in total bankroll depletion, and a small number ending in outsized wins.
For U.S. players in states where progressive networks are regulated — New Jersey, Pennsylvania, Michigan, West Virginia, and Connecticut among them — the contribution rate is disclosed in the game's paytable or help screen, though rarely in a format that makes the base-game RTP explicit. New Jersey's Division of Gaming Enforcement requires operators to publish the theoretical RTP of each game, but the published figure is the blended number, not the base-game number. A player comparing two machines with identical 96.0% published RTP may be comparing a 94.6% base game with a 1.4% meter against a 95.8% base game with a 0.2% meter. The machines are not equivalent.
Regulatory Treatment Across U.S. Jurisdictions
Contribution rate disclosure varies by state, and the variation is not trivial. Pennsylvania's Gaming Control Board requires slot manufacturers to file a mathematical analysis of each game, including the contribution rate to any progressive meter, but the filing is not required to be displayed to the player. Nevada's Regulation 14 governs slot machine design and requires that the theoretical RTP be posted, but does not mandate a breakdown between base-game and progressive components. Michigan's Gaming Control Board has taken a more granular approach, requiring that the contribution rate be stated in the game's on-screen information panel for machines operating under its jurisdiction.
The practical effect is that a player moving between states — or between online and retail — encounters inconsistent disclosure standards for the same underlying mechanic. An online progressive in Michigan may display its contribution rate; the same game's retail counterpart in Nevada may not. For an academic treatment, this is a natural experiment: it allows comparison of player behavior under differing disclosure regimes, though no published study has yet isolated the effect of contribution-rate transparency on machine selection.
Online Progressives and the Disclosure Gap
Online progressives introduce a further complication. Many are networked across multiple operators and jurisdictions, which means the meter's trigger frequency is a function of total wagering volume across the network, not the individual player's session. A player on a $0.20 spin is contributing to a meter that may be won by a player on a $20.00 spin in a different state. The contribution rate is the same, but the expected value per spin is not — the player's probability of triggering the jackpot scales with their wager, while the meter's size does not.
This asymmetry is not disclosed in most online game help screens. The contribution rate may be stated; the trigger probability is not. Without both numbers, the player cannot compute the meter's expected value, and the 0.4% gap between advertised and effective RTP remains invisible.
What the 0.4% Implies
If contribution rates routinely shift effective RTP by 0.4 points, then published RTP is a weaker decision input than most players assume. Two machines with identical advertised returns can have materially different base-game returns, and the difference is not disclosed in a comparable format. The implication is not that progressive slots are worse — the meter's expected value is real, and a player who values the variance is not making an error. The implication is that the number on the paytable is a blend, and blends conceal their components.
The open question is whether regulators will move toward mandating a two-line RTP disclosure — base game and progressive — as Michigan has begun to do. If they do, the 0.4% gap becomes visible, and players can decide whether the meter is worth the base-game sacrifice. If they do not, the gap persists, and the published number continues to describe a machine that no individual spin actually experiences.